
 Dr. G. O. C. Okwuibe
Germany Spent Five Days Leaning on Imports — Week 36, 2026
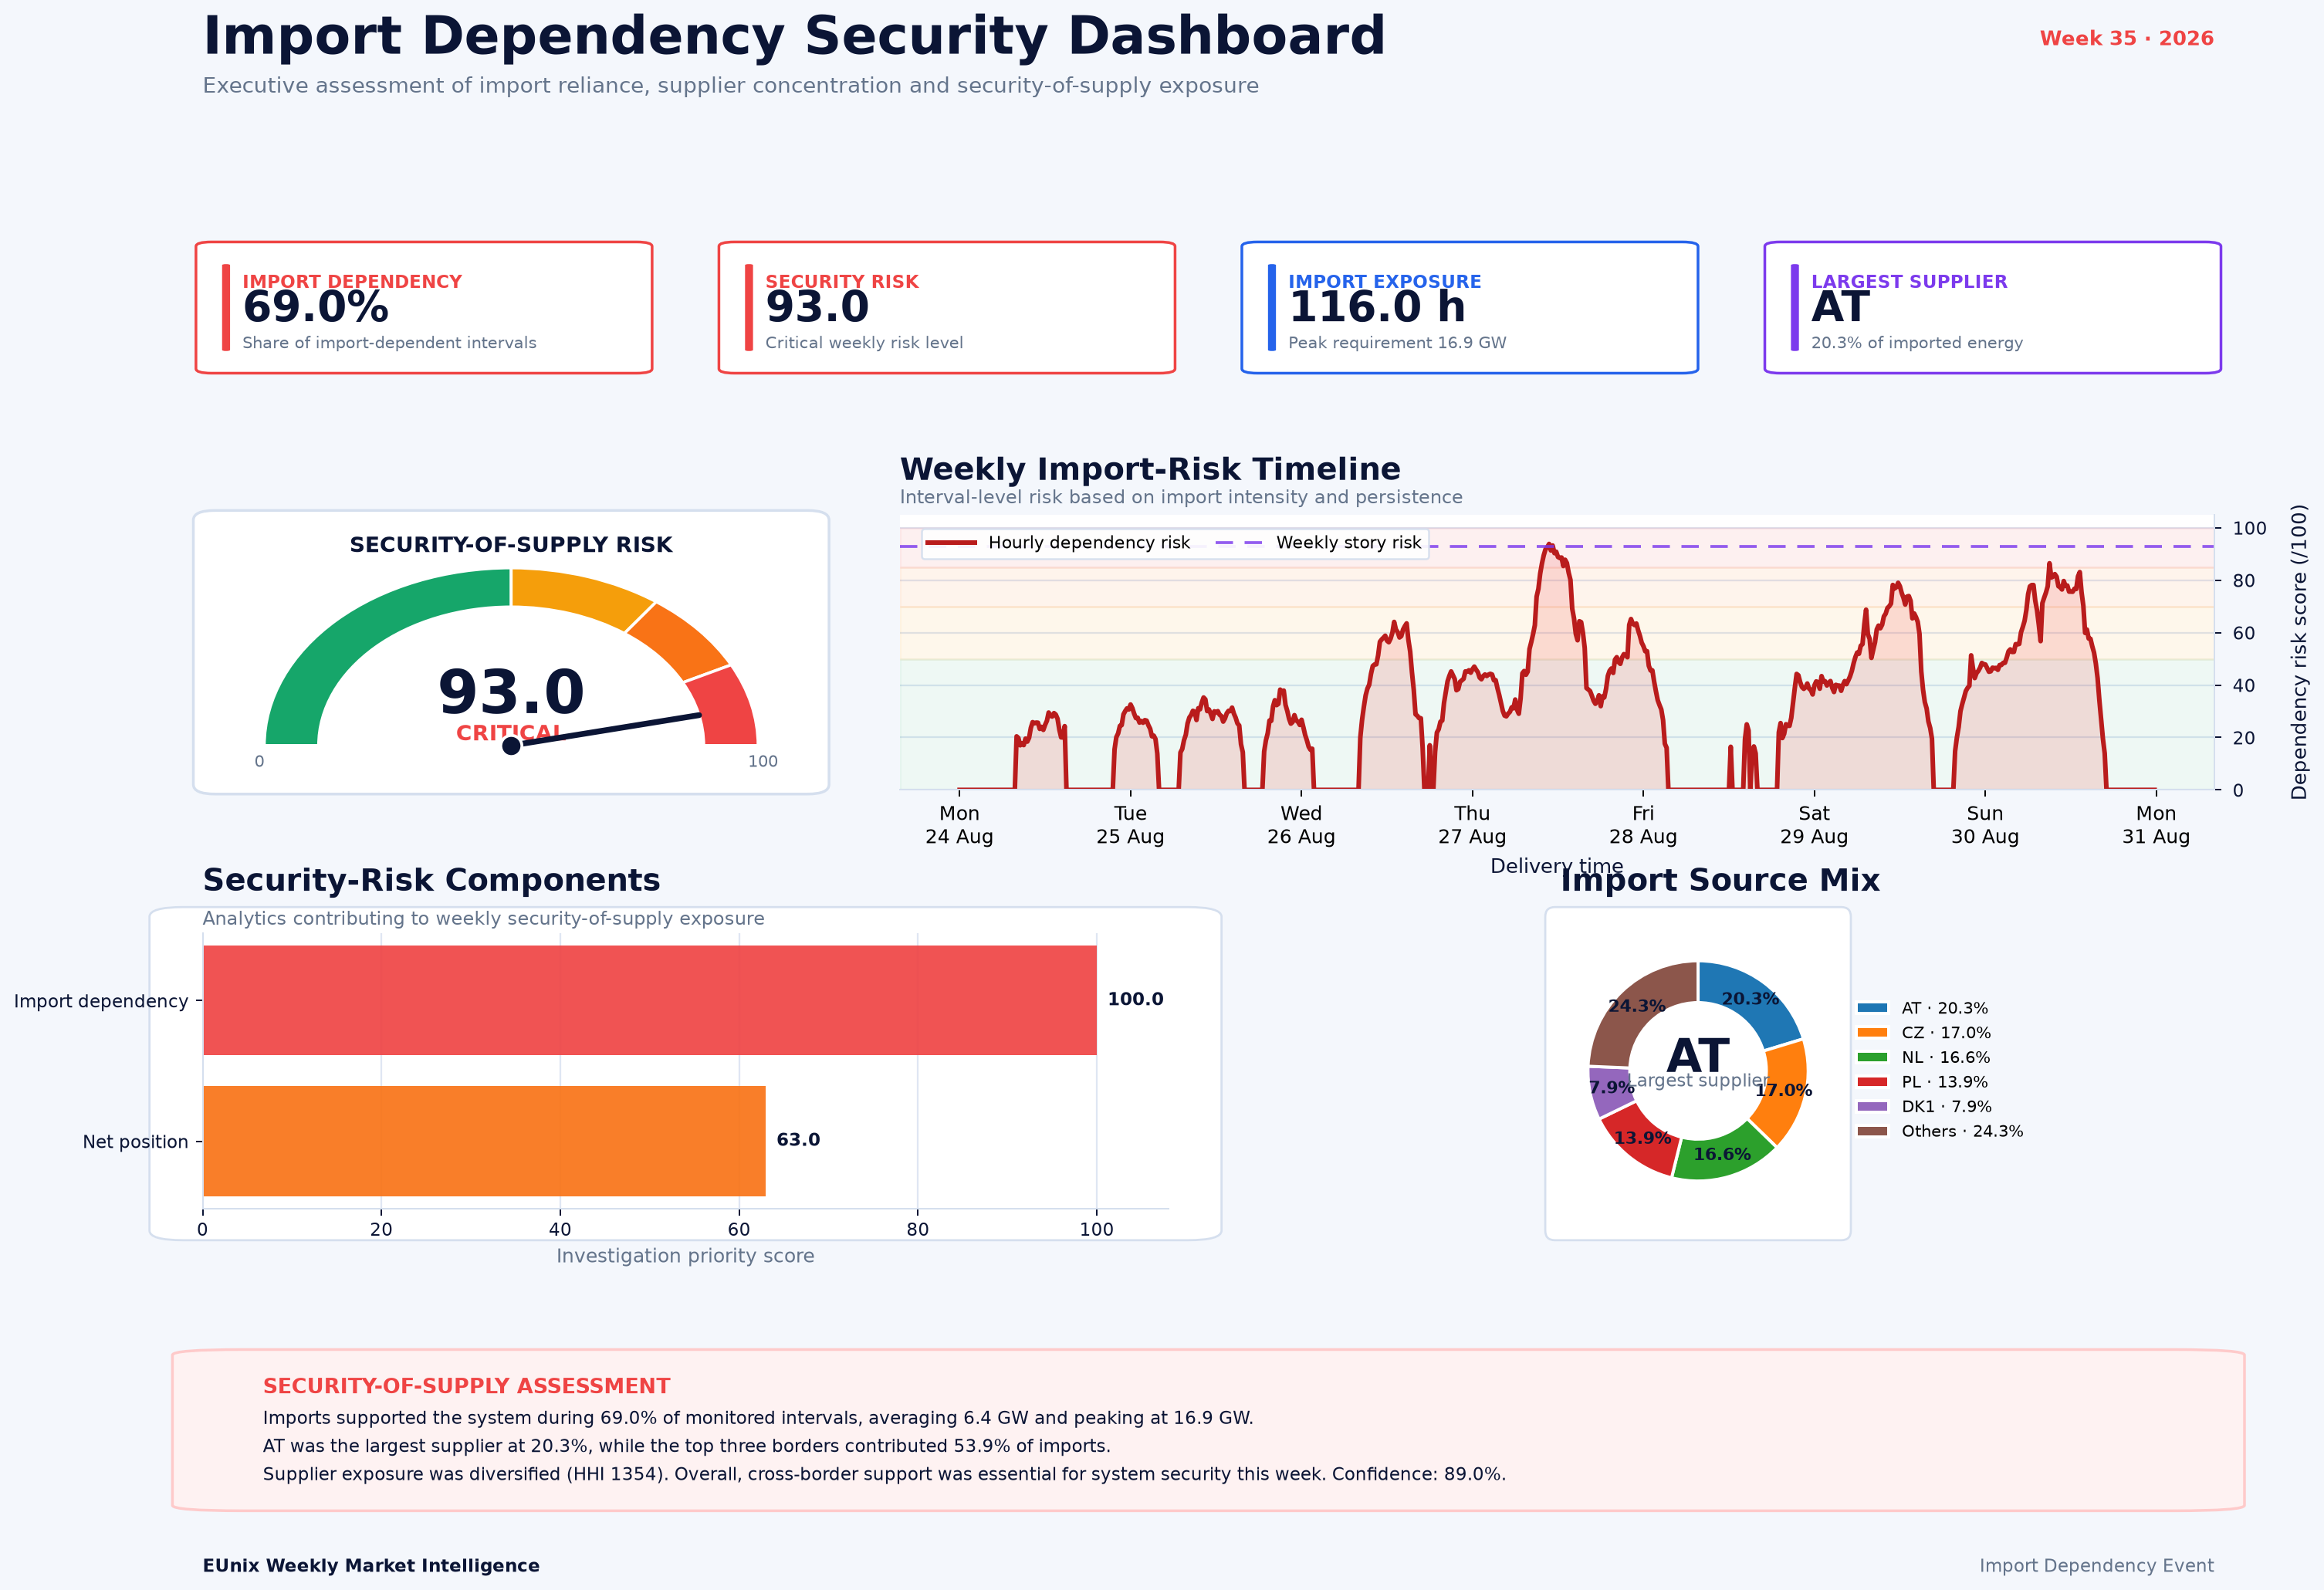
Germany’s cross-border dependence intensified in Week 36. Imports were present during 71.7% of monitored intervals, or 120.5 hours, with physical imports peaking at 13.91 GW. Weekly imported energy reached 830 GWh, exceeding exports of 664 GWh by about 167 GWh. EUnix Intelligence ranked the Import Dependency Event #1, with a 91.46 priority score and 87.46% confidence.
Charts
Market Overview
The maximum physical import requirement reached 13.91 GW, while estimated weekly imported energy totalled 830 GWh. Gross exports were lower at 664 GWh, leaving the week with approximately 167 GWh more imports than exports.
The daily profile shows that import requirements remained material across most of the week. Peak daily requirements ranged from roughly 10.1 GW to 13.9 GW, with the weekly maximum occurring on Saturday, 5 September. The timeline additionally identifies a sustained import episode lasting approximately 70 hours.
Import exposure was nevertheless distributed across several neighbouring markets. Austria was the largest individual source at 21.8% of imported energy, followed by the Czech Republic at 17.9% and Poland at 13.9%. Together, the three largest suppliers contributed 53.5%.
The EUnix Intelligence Platform assigned the event a 91.46/100 story priority, with import dependency scoring 96.86, scheduled imports 93.02, and net-position analytics 63.88.
Key Observations
Interpretation
This distinguishes Week 36 from an import event caused only by a short system shock. The heatmap and hourly timeline show repeated and extended cross-border support across several days, particularly from Thursday through the weekend.
At the same time, supplier concentration does not appear to have been dominated by a single border. Austria was the largest contributor, but its 21.8% share remained well below a majority. The top-three share of 53.5% indicates meaningful concentration while still showing substantial diversification across neighbouring systems.
One particularly interesting signal is the −0.87 correlation between physical imports and residual load. Within this dataset, higher imports did not simply coincide with higher domestic residual demand. That suggests the observed import pattern reflected broader cross-border market and system conditions rather than being explainable by domestic residual load alone.
The result is therefore best understood as structural cross-border dependence during specific operating conditions, not simply as a conventional domestic supply-shortage story.
Revenue Insight
Market Outlook
Attention should also remain on the duration of import episodes. The roughly 70-hour sustained episode is particularly important because prolonged dependence creates a different system-risk profile from brief import peaks.
Border diversification should be monitored alongside total import volumes. The present supplier mix remains relatively distributed, but any future rise in both dependency and supplier concentration would increase exposure to conditions on a smaller number of interconnectors.
Finally, the strong inverse residual-load relationship deserves continued investigation. If the pattern recurs, it would strengthen the case that Germany’s cross-border position is being shaped by wider regional market dynamics rather than domestic residual-load conditions alone.
Simulation Note
Written by
Dr. G. O. C. Okwuibe
Quantitative Energy Systems Expert | Electricity Market & BESS
Dr. Godwin Okwuibe is a quantitative energy system expert specializing in electricity markets, battery storage optimization, and flexibility market design. His work focusses on translating complex market dynamics into actionable insights for industry stakehold...