
 Dr. G. O. C. Okwuibe
The Forecast Was Wrong — But the System Risk Was Bigger | Week 34, 2026
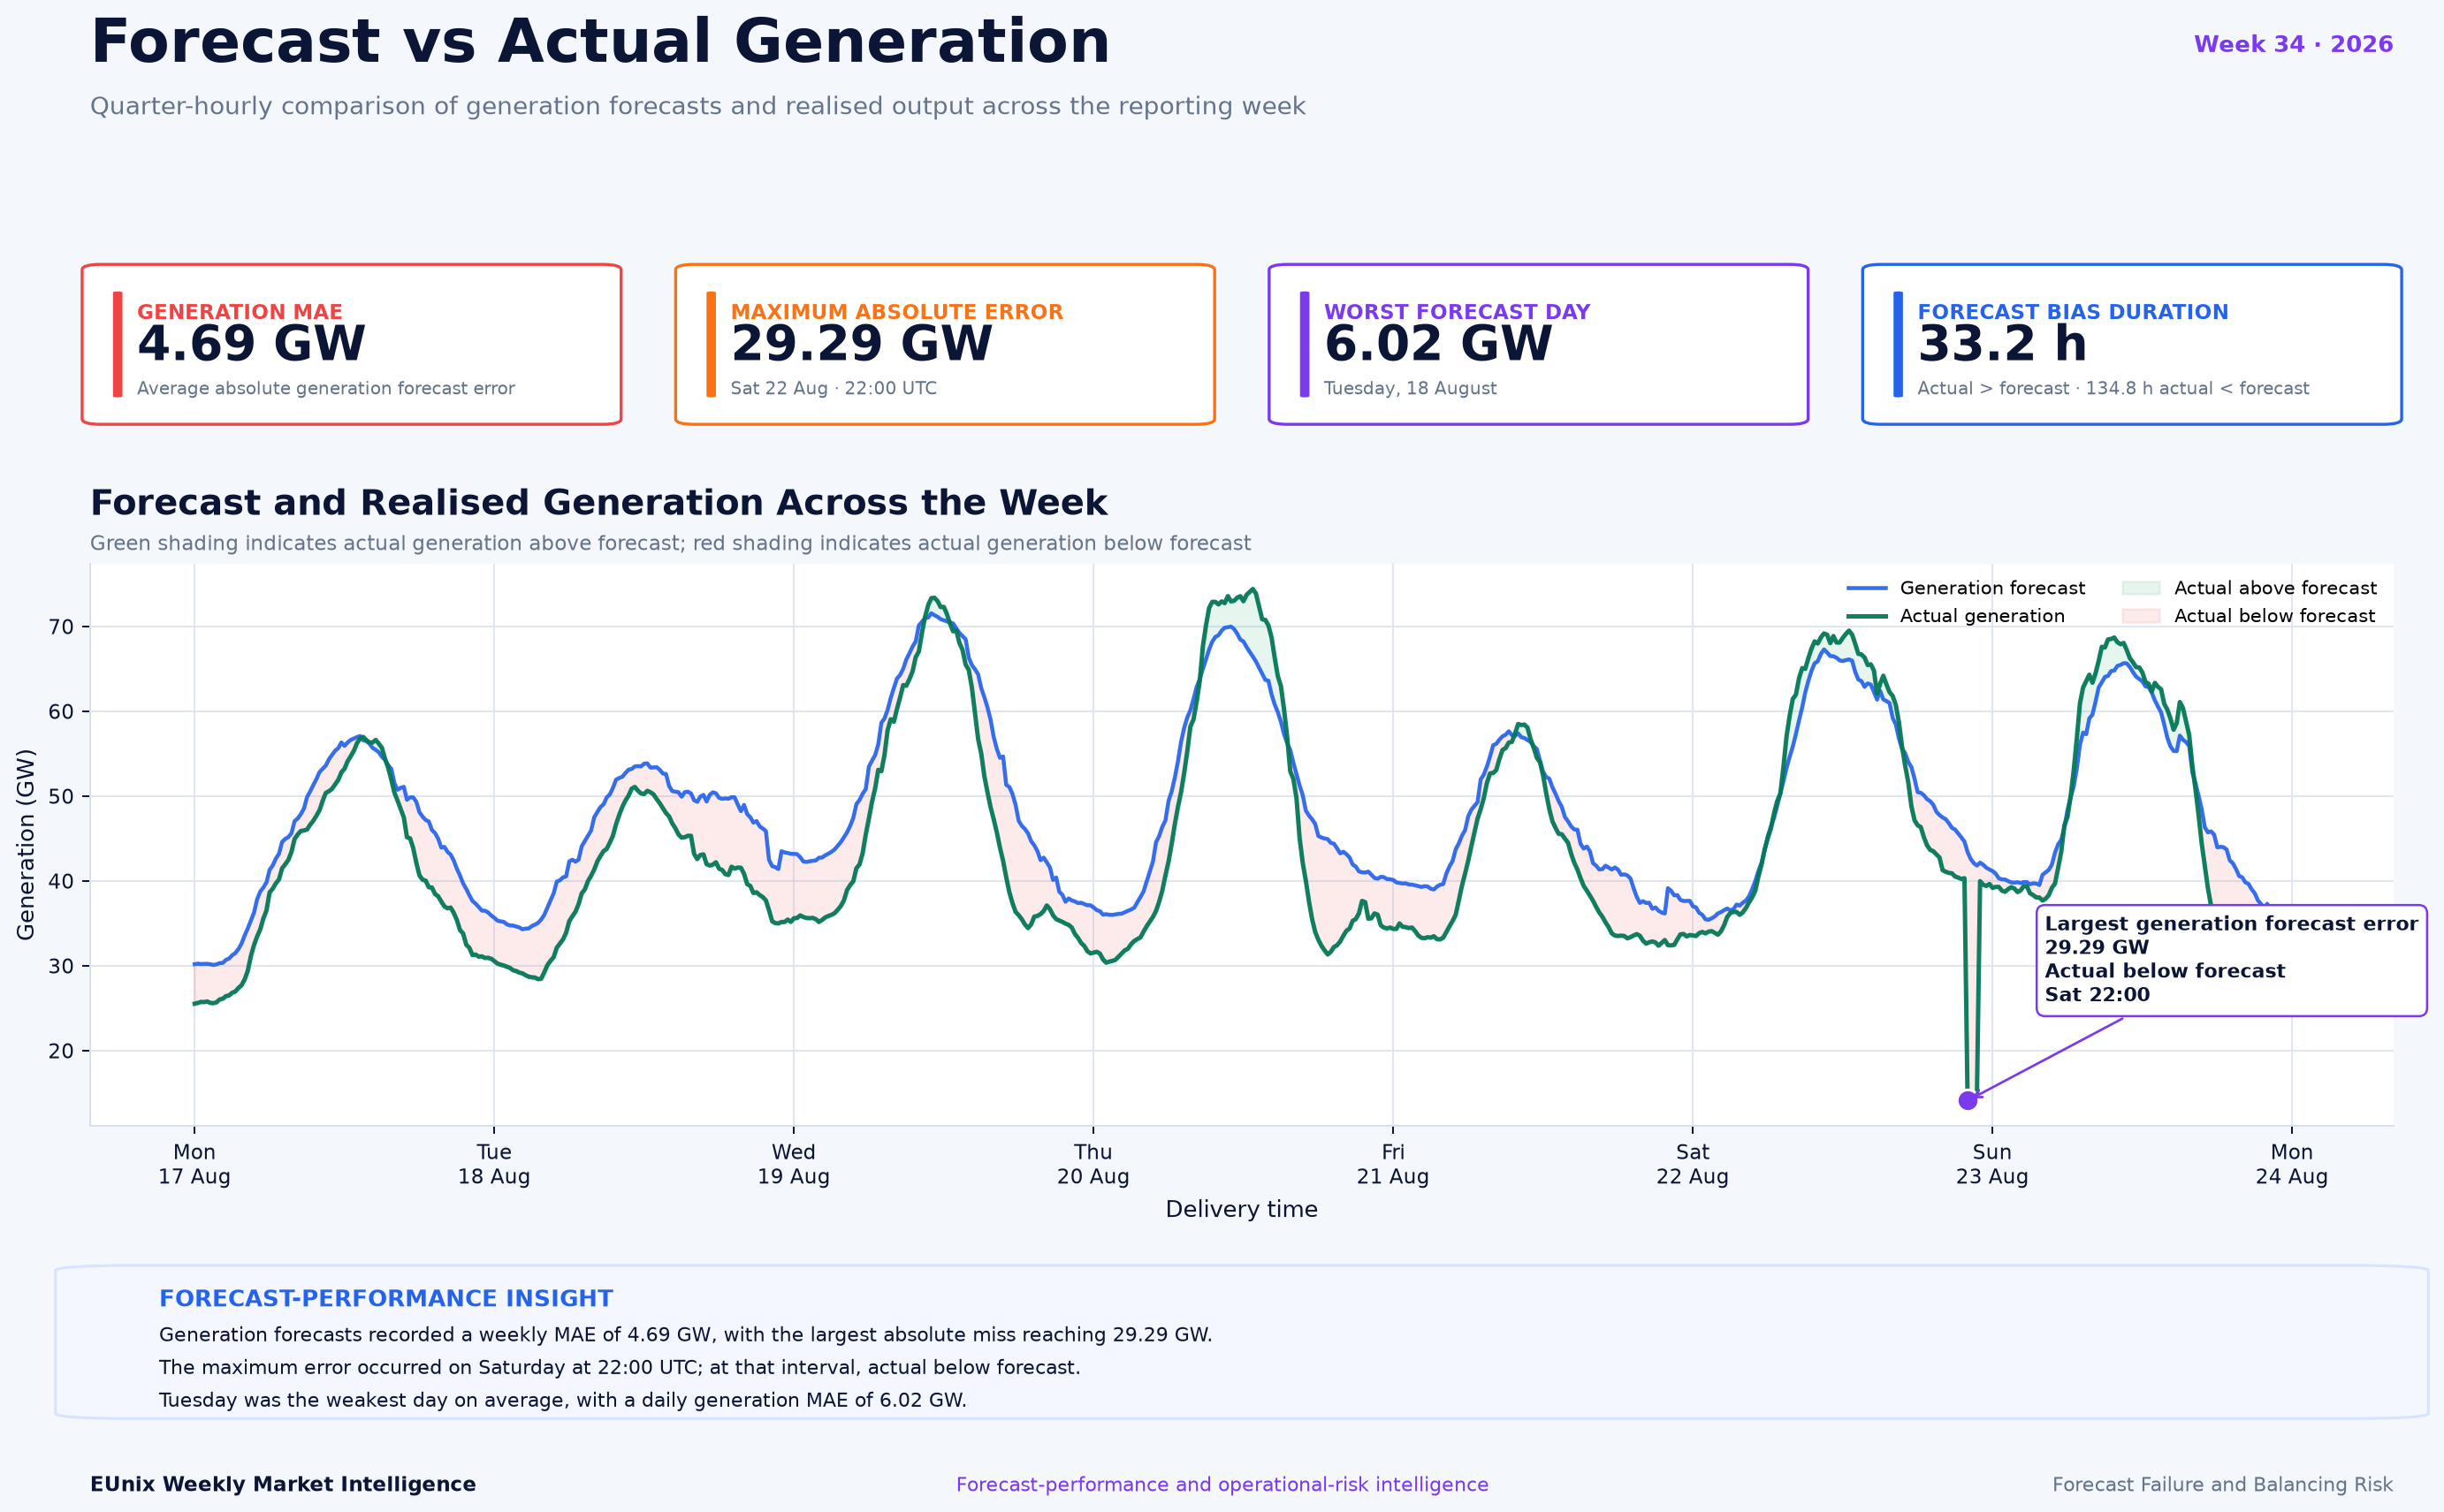
Germany entered Week 34 with a clear forecasting problem: generation forecasts missed realised output by 4.69 GW on average, while the largest error reached 29.29 GW. At the same time, schedule deviation climbed to 31.56 GW, creating elevated operational exposure. EUnix ranked Forecast Failure and Balancing Risk as the week’s #2 story, with a priority score of 85.58 and 77.44% confidence.
Charts
Market Overview
The errors were not directionally balanced. Mean signed error was -3.59 GW, showing a systematic over-forecast bias. Actual generation exceeded forecast for only 33.2 hours, compared with 134.8 hours when forecast generation exceeded realised output. All ten of the largest forecast failures were over-forecast events.
Forecast performance also varied significantly by time of day. 18:00 UTC recorded the highest average hourly forecast error at 8.77 GW and the strongest hourly bias at -8.77 GW, identifying the evening period as an important concentration of forecast risk.
Operationally, the week also contained substantial physical-versus-scheduled deviations. Maximum schedule deviation reached 31.56 GW, while the maximum border-balancing gap reached 2.68 GW. However, the signed correlation between forecast error and schedule deviation was only -0.03, and the magnitude correlation was just +0.12.
The EUnix Intelligence Platform consequently classified the story as critical, with forecast quality scoring 94.99/100, schedule deviation 88.78/100, and border balancing 33.48/100. The overall story priority reached 85.58.
Key Observations
Interpretation
That distinction matters operationally. Random errors can partly offset each other over time, but persistent directional bias can repeatedly leave market participants and system operators positioned against realised conditions. The -3.59 GW mean signed error therefore deserves as much attention as the headline 29.29 GW maximum miss.
The concentration of error around the evening period adds another dimension. With 18:00 UTC showing the highest average hourly MAE, forecast uncertainty was particularly elevated during a period when system conditions can already be changing rapidly.
At the same time, the schedule-deviation analysis provides an important caution. Although the week contained both major forecast misses and substantial schedule deviations, their interval-level relationship was weak. The data therefore identify concurrent operational risks, not evidence that forecast failures directly caused the observed schedule deviations.
The resulting picture is one of layered uncertainty: imperfect generation forecasts, persistent directional bias, significant schedule deviations and measurable border-balancing exposure occurring within the same operating week.
Revenue Insight
Market Outlook
The second is the evening risk window. If forecast MAE continues to concentrate around 18:00 UTC, that period should receive particular attention in forecast updates, intraday position management and flexibility scheduling.
Schedule deviations should also be monitored independently from forecast errors. Week 34 demonstrated that large deviations can coexist with major forecast misses without showing strong statistical co-movement.
A particularly important signal would be simultaneous deterioration in forecast accuracy, schedule adherence and border-balancing exposure. Such convergence would increase the operational relevance of the balancing-risk story considerably.
For flexible portfolios, the practical opportunity lies in being able to respond when forecasts change or realised production diverges from scheduled positions—not in assuming that every forecast miss will automatically translate into balancing activation or revenue.
Simulation Note
Written by
Dr. G. O. C. Okwuibe
Quantitative Energy Systems Expert | Electricity Market & BESS
Dr. Godwin Okwuibe is a quantitative energy system expert specializing in electricity markets, battery storage optimization, and flexibility market design. His work focusses on translating complex market dynamics into actionable insights for industry stakehold...