
 Dr. G. O. C. Okwuibe
The Midday Trough Became an Evening Flexibility Test — Week 37, 2026
Germany’s residual-load profile became a pronounced flexibility challenge in Week 37. The EUnix Intelligence Platform identified a 52.8 GW maximum duck depth, while the strongest interval-level upward ramp reached 21.2 GW/h. The system recorded 68 critical residual-ramp intervals, as deep daytime depressions repeatedly gave way to steep afternoon and evening recovery. The story ranked #1, with a priority score of 89.66 and confidence of 82.48%.
Charts
Market Overview
The weekly analytics identified a maximum duck depth of 52.8 GW. Looking at individual daily profiles, Tuesday, 8 September produced the deepest daily curve at 40.9 GW and the lowest observed residual load of −3.5 GW. Daily residual-load minima occurred around 11:00 on average, establishing a clear midday flexibility window.
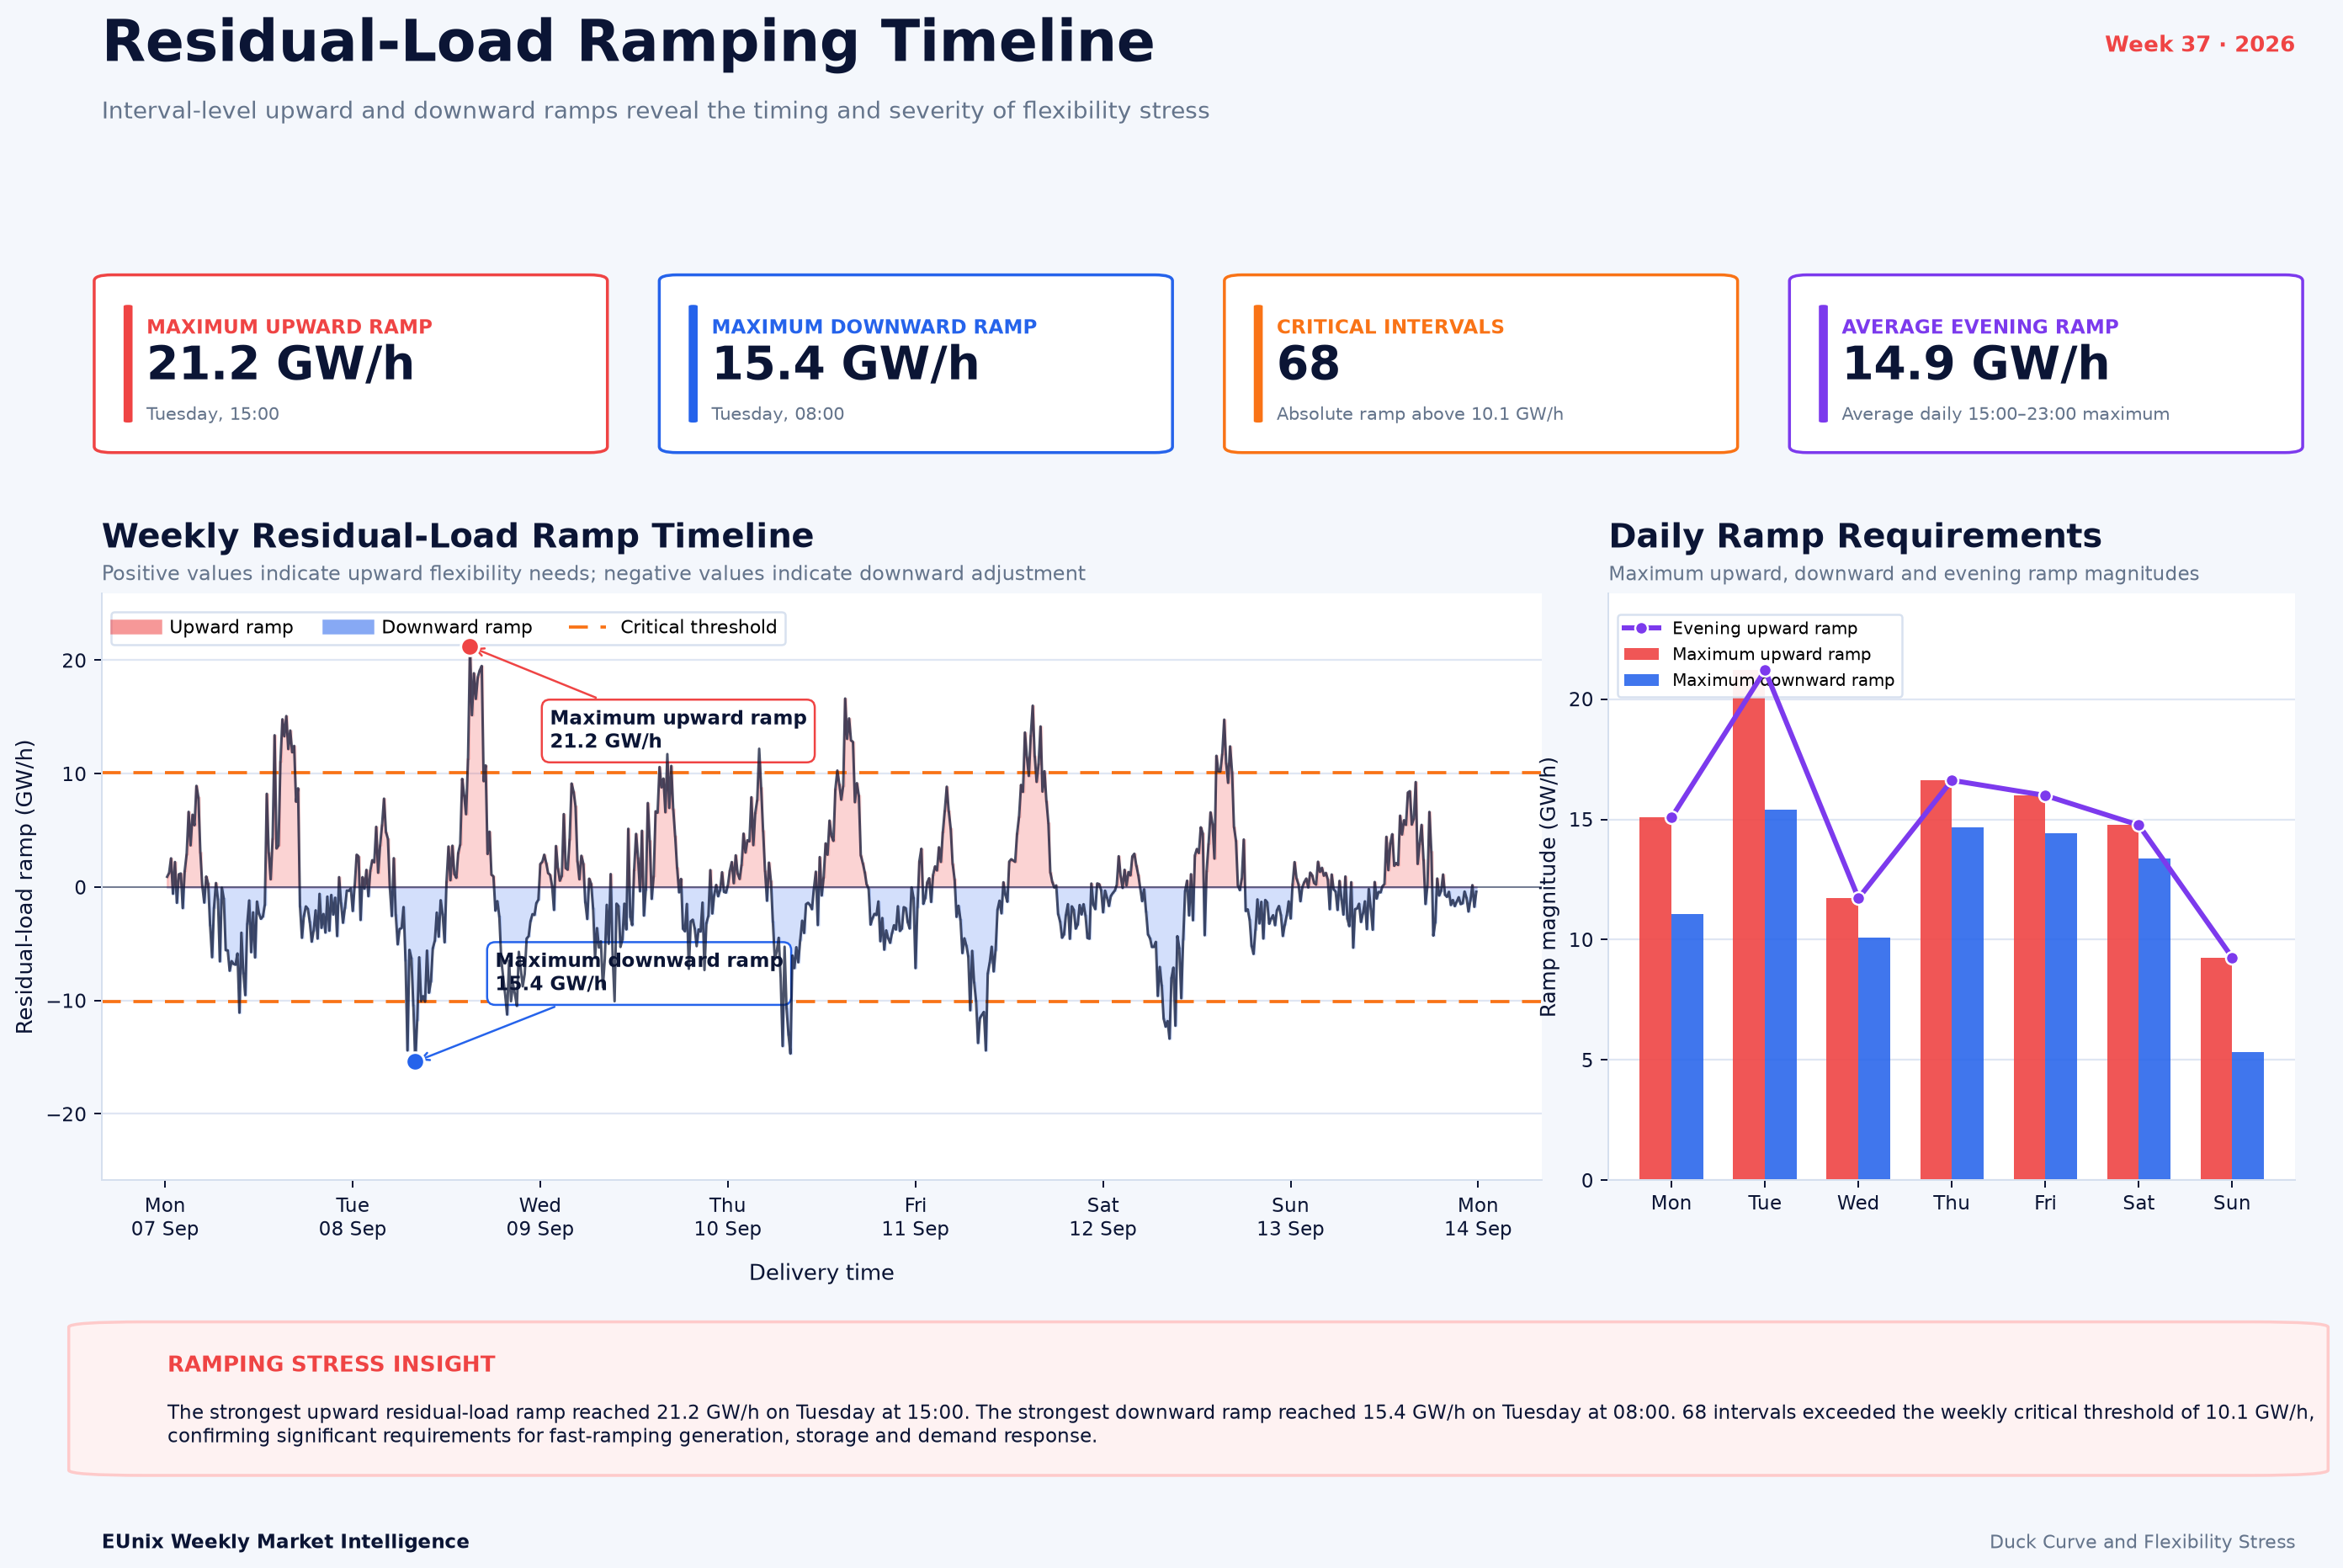
The other side of the duck curve emerged during the afternoon recovery. The maximum interval-level upward residual-load ramp reached 21.2 GW/h at 15:00 on Tuesday, while the maximum downward ramp was 15.4 GW/h at 08:00. Across the week, 68 intervals exceeded the 10.1 GW/h critical ramp threshold used by the platform.
Flexibility stress was not confined to Tuesday. The critical-ramping heatmap identifies Friday as the most stressed day, with four critical hourly cells, while the strongest concentration of ramping stress generally occurred around 15:00.
The EUnix Intelligence Platform ranked the story at 89.66/100. Demand-response opportunity was the strongest supporting analytic at 95.06, followed by duck curve at 93.41, ramping at 76.38, and storage utilization at 63.07.
Key Observations
Interpretation
Tuesday provides the clearest example. Residual load fell below zero at its lowest point and subsequently recovered sharply. That transition means the system first needed resources capable of absorbing or shifting electricity and later resources capable of responding quickly as residual demand returned.
The system profile explains the underlying shape. Renewable generation rose toward roughly 49 GW around midday in the average intraday profile while demand remained comparatively stable. As renewable output subsequently declined, residual load climbed rapidly into the evening.
Importantly, the flexibility requirement was recurring rather than isolated. The ramping timeline shows repeated upward and downward movements across the entire week, while the heatmap identifies stress around similar morning and afternoon periods on several days.
The operational challenge is therefore two-sided: absorb or shift electricity during deep residual-load troughs, then provide rapid upward flexibility during the recovery. Storage, responsive demand and other fast-ramping resources can address different parts of that same intraday cycle.
Revenue Insight
Market Outlook
The timing of the trough is particularly important. An average minimum around 11:00, followed by afternoon ramping stress concentrated near 15:00, defines a relatively clear intraday flexibility cycle that storage and responsive loads could potentially exploit.
Future weeks should therefore be assessed not only by maximum duck depth, but also by trough timing, duration, subsequent ramp magnitude and the number of critical ramp intervals. A deeper trough is not necessarily more challenging if the recovery is gradual; the combination of depth and speed determines the flexibility requirement.
Week 37 consequently points toward a system in which renewable integration increasingly depends on the ability to shift energy through time. The stronger and more frequent these intraday swings become, the greater the operational relevance of storage, demand response and fast-ramping flexibility.
Simulation Note
Written by
Dr. G. O. C. Okwuibe
Quantitative Energy Systems Expert | Electricity Market & BESS
Dr. Godwin Okwuibe is a quantitative energy system expert specializing in electricity markets, battery storage optimization, and flexibility market design. His work focusses on translating complex market dynamics into actionable insights for industry stakehold...