
 Dr. G. O. C. Okwuibe
When Imports Become the Safety Net — Week 35, 2026
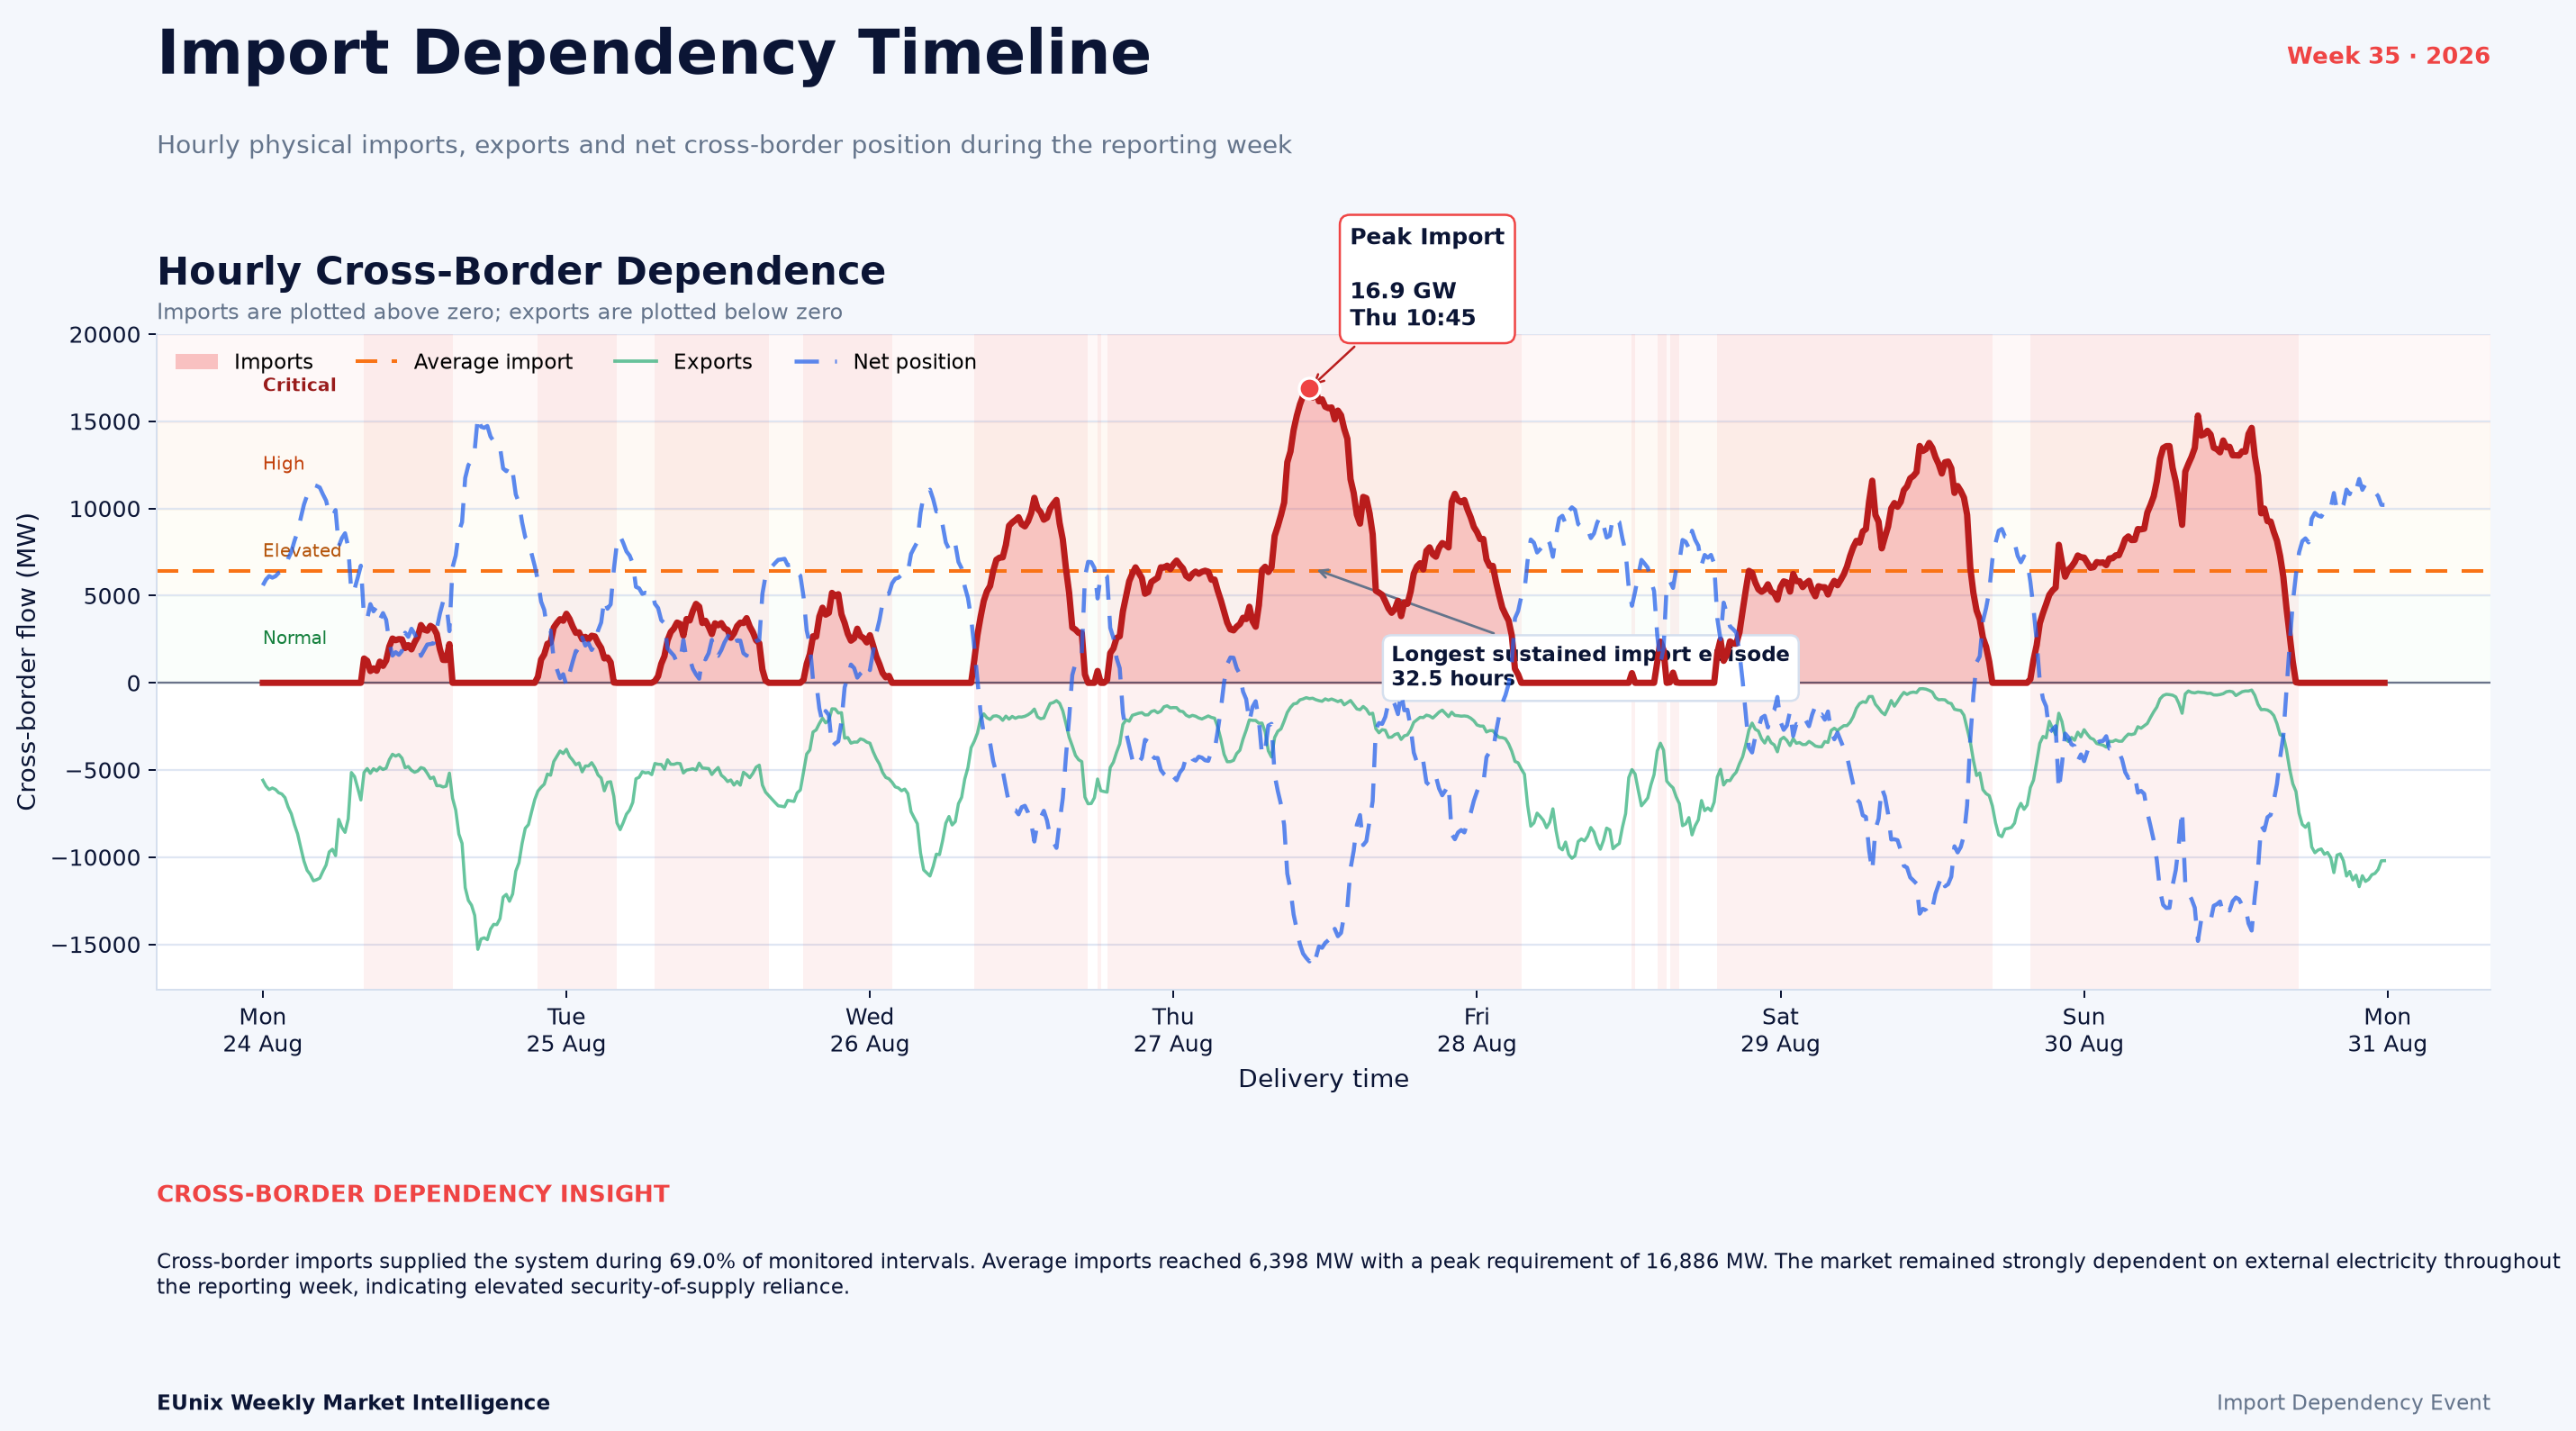
Cross-border electricity became a key feature of Germany’s system in Week 35. Imports were required during 69.0% of monitored intervals, or 116 hours, and peaked at 16.89 GW. Yet Germany remained a net exporter over the week, with 787 GWh exported against 742 GWh imported. This highlights a key distinction: strong hourly import dependence can coexist with a weekly net-export position. EUnix Intelligence ranked the Import Dependency Event #1, with a priority score of 92.97 and confidence of 88.98%.
Charts
Market Overview
The daily profile reveals how unevenly this dependence developed. Gross imported energy was only 20 GWh on Monday, before increasing to 51 GWh Tuesday and 92 GWh Wednesday. It then surged to 205 GWh on Thursday, the week's largest daily import volume. Imports remained significant over the weekend at 162 GWh Saturday and 173 GWh Sunday.
Crucially, high import dependence did not make Germany a net energy importer over the entire week. The charts record 742 GWh of gross imports against 787 GWh of gross exports, leaving imports minus exports at -45 GWh. This coexistence of substantial imports and even larger exports demonstrates the importance of distinguishing gross cross-border dependence at specific times from the weekly net energy balance.
The geographical supply mix was also relatively diversified. Austria (AT) was the largest individual source, contributing 270 GWh, or 20.3% of the border-level imported energy shown in the source analysis. The Czech Republic followed with 17.0%, the Netherlands with 16.6%, and Poland with 13.9%. The three largest borders collectively accounted for 53.9%, while the import-energy concentration index stood at 1,354.
The EUnix Intelligence Platform classified the event as critical, assigning a story priority of 92.97. Import dependency itself scored 100, scheduled imports 94.11, and net position 62.97, making cross-border dependence the strongest analytical signal of the reporting week.
Key Observations
Interpretation
This makes Week 35 better understood as a story of temporal dependence rather than aggregate energy dependence. Cross-border trade repeatedly supplied electricity when the system was importing, but those flows were subsequently offset by sufficiently large exports during other periods.
The residual-load analysis makes the story more interesting. Imports had a strong negative correlation of -0.87 with residual load. In this dataset, imports tended to fall as residual load increased rather than rise with domestic residual demand. That means the observed import pattern cannot simply be interpreted as neighbouring countries filling periods of high domestic residual load.
The data provided do not identify the economic causes of that relationship. Prices, generation costs, plant availability, congestion and other market conditions are not included in the supplied charts. What can be concluded is narrower but important: Week 35 import dependence was not explained by residual load alone.
Supplier diversification also moderates the security interpretation. Austria was the largest source, but at 20.3% it did not dominate the import portfolio, while the top three borders represented 53.9%. Cross-border reliance was therefore high, but distributed across several neighbouring interfaces rather than concentrated overwhelmingly on a single border.
Revenue Insight
Market Outlook
Particular attention should be paid to the recurrence of prolonged import episodes. The 32.5-hour sustained episode matters differently from a brief 16.89 GW spike: persistence determines how long the system must rely on external supply rather than merely the severity of the maximum interval.
The import source mix should also be monitored. Week 35's largest individual supplier accounted for only 20.3%, providing some diversification. A future increase in both overall import dependence and concentration on one or two borders would represent a materially different risk profile.
Another important indicator is the relationship between imports and residual load. The current -0.87 correlation suggests that domestic residual-load pressure was not the obvious driver of imports this week. Whether that relationship persists, disappears or reverses in subsequent weeks would help distinguish a recurring market structure from a temporary pattern.
Most importantly, Week 35 demonstrates why weekly net-import statistics alone can conceal operational dependence. Future monitoring should therefore retain both perspectives: net energy position for the overall trade balance and interval-level physical imports for security-of-supply exposure.
Simulation Note
Written by
Dr. G. O. C. Okwuibe
Quantitative Energy Systems Expert | Electricity Market & BESS
Dr. Godwin Okwuibe is a quantitative energy system expert specializing in electricity markets, battery storage optimization, and flexibility market design. His work focusses on translating complex market dynamics into actionable insights for industry stakehold...