
 Dr. G. O. C. Okwuibe
When Power Prices Went From €437.6 to Below Zero, Batteries Found Their Window — Week 38, 2026
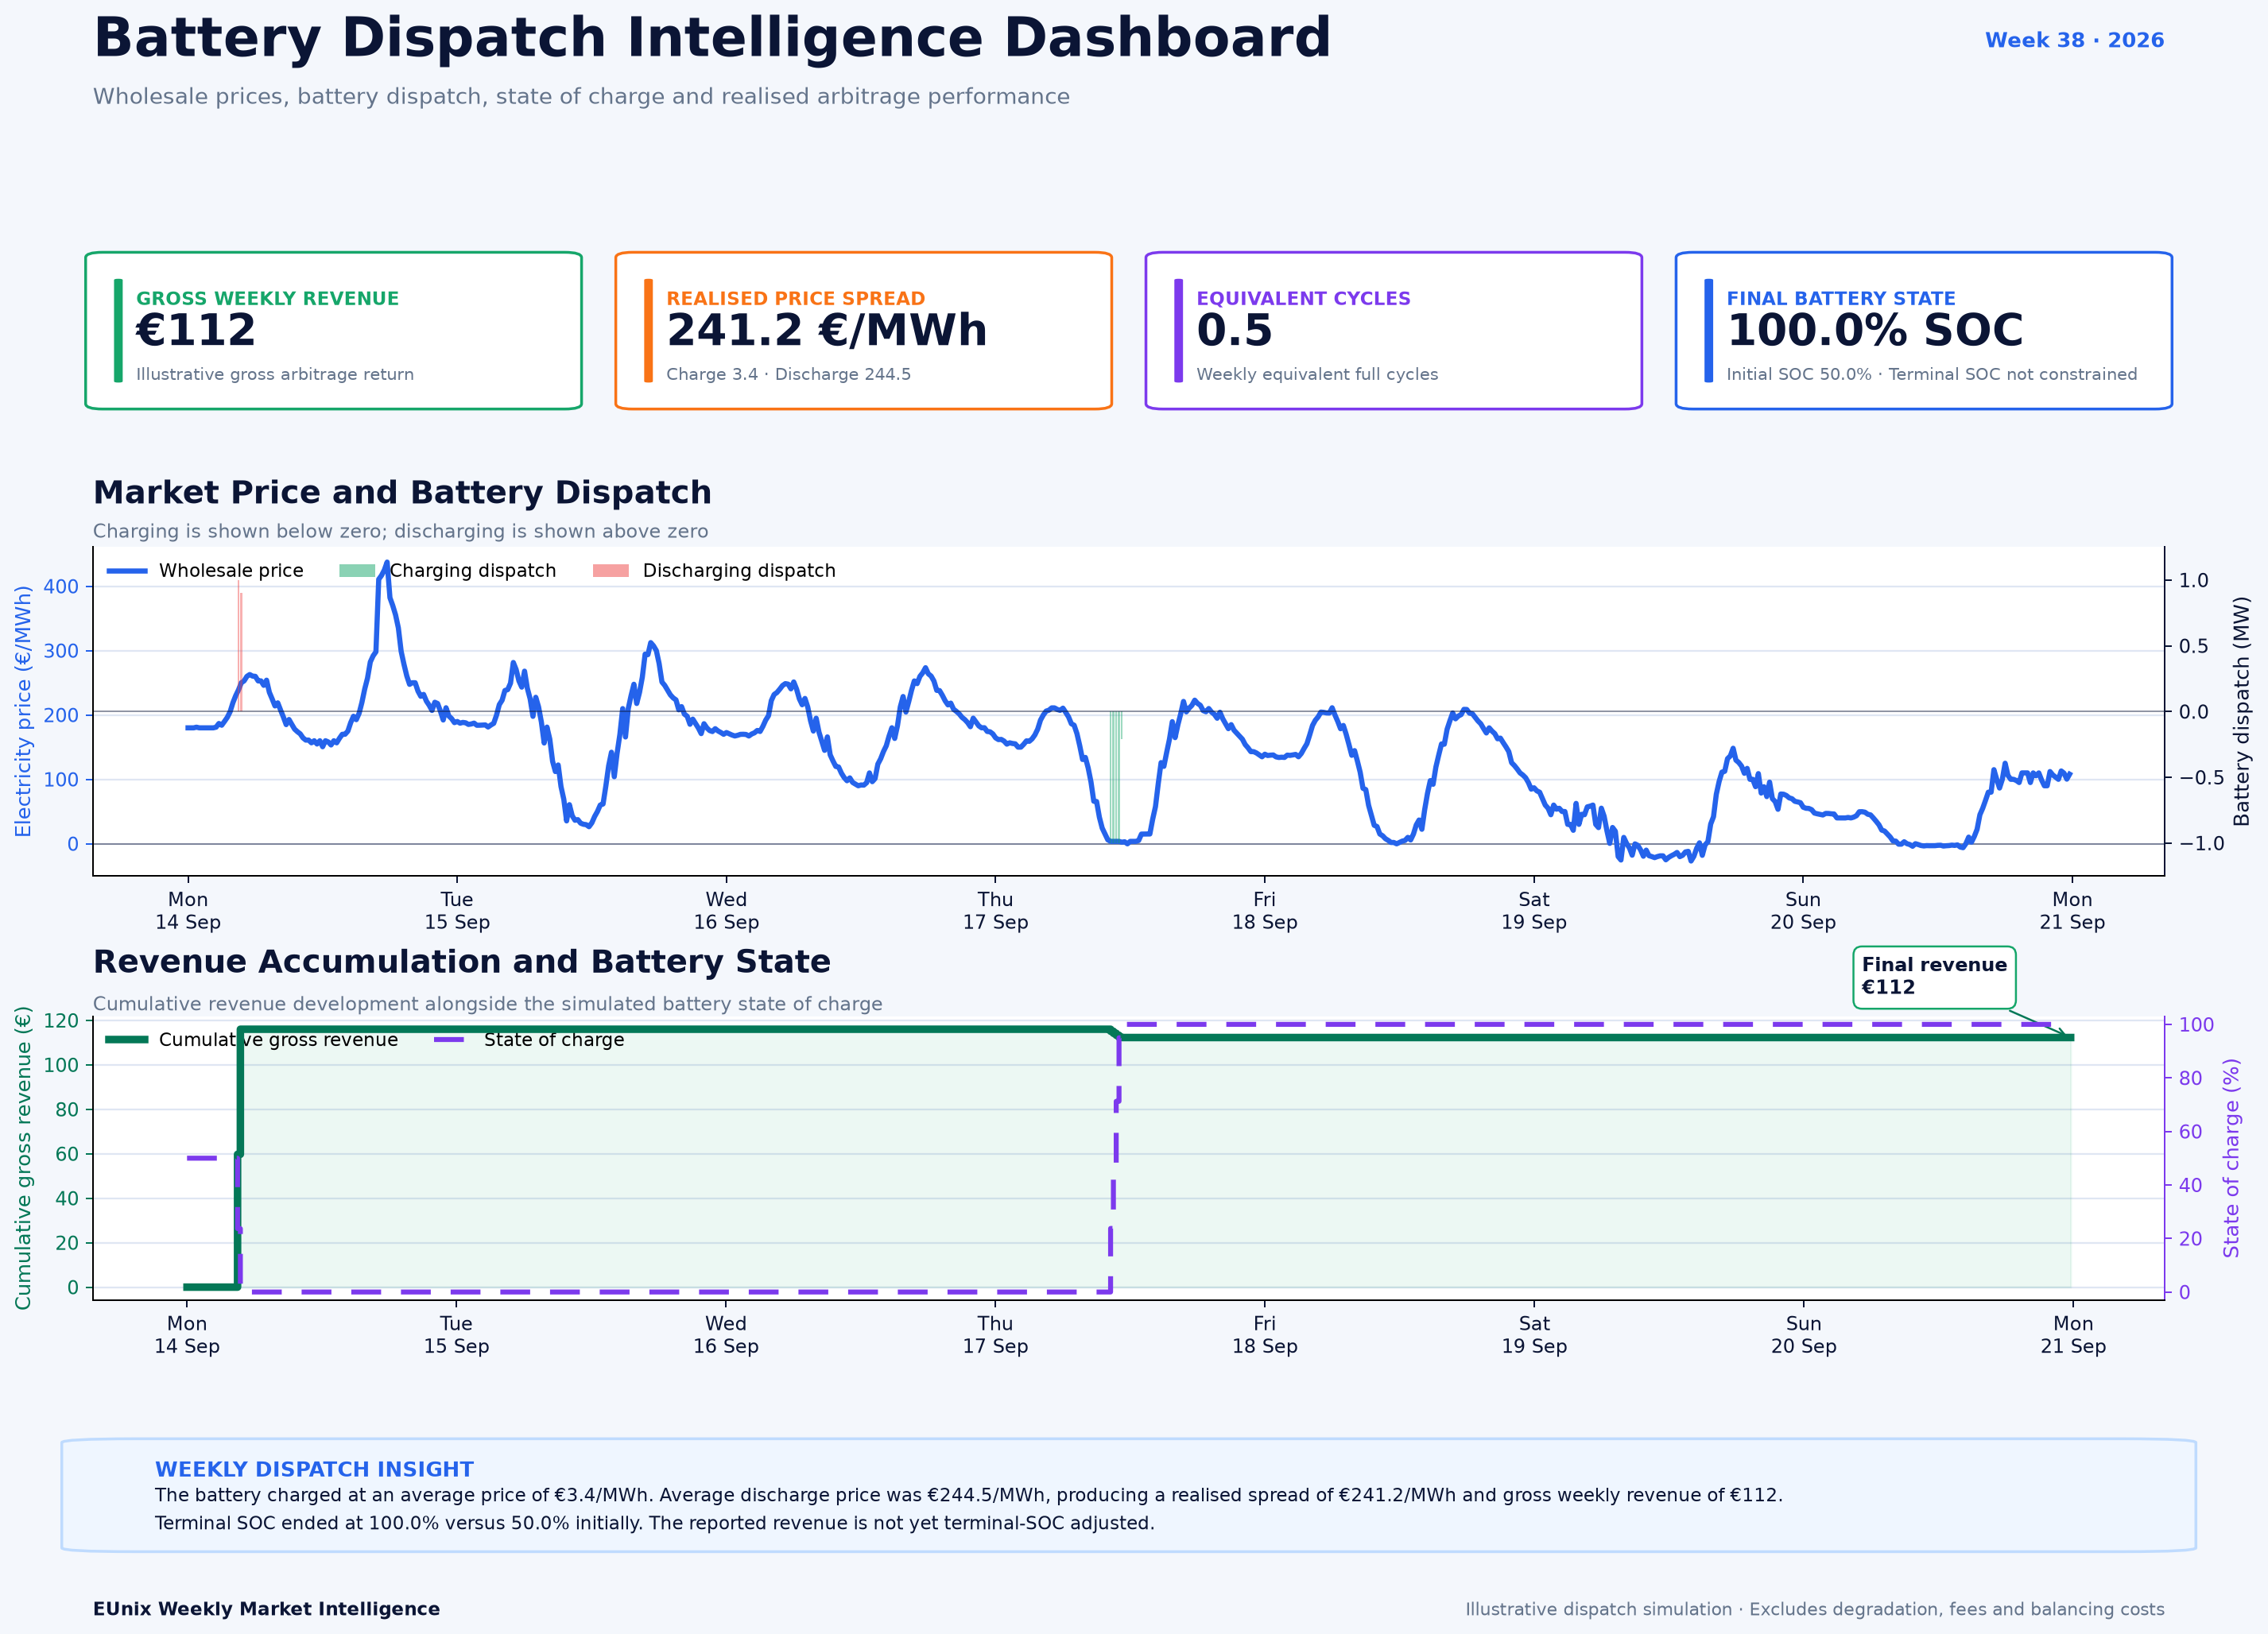
Week 38 delivered strong battery-arbitrage conditions as wholesale prices ranged from €437.6/MWh to −€26.9/MWh. The EUnix Intelligence Platform identified a maximum daily spread of €286.9/MWh and 35 strong opportunity hours, ranking Battery Arbitrage Opportunity #1 with a 92.9/100 priority score. An illustrative 1 MW/1 MWh battery captured part of this volatility, generating €112 in gross weekly revenue.
Charts
Market Overview
The strongest price conditions appeared early in the week. Monday and Tuesday recorded the largest daily arbitrage spreads at approximately €286.9/MWh, while Thursday still offered a spread above €220/MWh. Even the lowest daily spread, recorded on Sunday, remained €131.2/MWh. The weekly pattern therefore represented more than a single extreme-price event.
The timing of the opportunity also changed materially during the week. The battery-opportunity timeline shows pronounced discharge signals during Monday to Wednesday, with additional evening discharge windows later in the working week. Charging signals became increasingly visible from Tuesday onward and were especially persistent during Saturday and Sunday, coinciding with the week's lowest-price environment.
Negative prices added another dimension to the storage opportunity. The weekly minimum of −€26.9/MWh occurred on Saturday, while the price curve also approached or crossed zero during other late-week periods. The platform consequently assigned the negative-price analytic an investigation-priority score of 83.36, alongside 82.33 for price volatility and 94.73 for battery opportunity.
Taken together, these signals produced 35 strong battery-opportunity hours and pushed the Battery Arbitrage Opportunity story to 92.92/100, classified as Critical. Its intelligence components were also consistently high: severity 98.8, impact 97.6, opportunity/risk 86.4, novelty 87.2, and confidence 88.8.
Key Observations
Interpretation
The weekly price curve illustrates this particularly well. Early-week prices repeatedly climbed above €200/MWh and reached €437.6/MWh, while later periods moved toward zero and eventually negative territory. That dispersion created both discharge value and low-cost charging opportunities, although the best charging and selling periods did not necessarily occur within the same day.
The daily spread metric reinforces the persistence of the signal. Opportunities above roughly €175/MWh appeared on six of the seven days, and the maximum reached €286.9/MWh. This suggests that Week 38's storage signal was not dependent solely on the single €437.6/MWh price spike.
However, a large theoretical daily spread should not be confused with automatically realisable battery revenue. A physical battery is constrained by its state of charge, power rating, energy capacity, efficiency and the chronological sequence of prices. The simulation illustrates this distinction: despite very large market spreads, the battery completed only around 0.5 equivalent cycles under the illustrated dispatch.
This makes Week 38 fundamentally a dispatch-quality story. Identifying price volatility is only the first step; value depends on deciding when to preserve stored energy, when to charge, and which high-price interval justifies discharge.
Revenue Insight
Market Outlook
Negative-price periods deserve particular attention. Week 38's −€26.9/MWh minimum and extended late-week low-price windows materially changed the charging environment. If such periods recur alongside later high-price intervals, they can strengthen the economic case for price-responsive storage.
The changing opportunity pattern across the week is equally important. Early-week conditions favoured stronger discharge signals, while Saturday and Sunday were dominated by charging opportunities. This shows why a battery strategy based on fixed daily operating hours may leave value unrealised when market conditions shift.
Future weekly analysis should therefore track the interaction between maximum spread, duration of low-price windows, negative-price frequency, strong-opportunity hours and actually realisable dispatch revenue. The spread identifies potential; chronological optimization determines how much of that potential a physical battery can capture.
Week 38 ultimately reinforces the commercial role of storage as a temporal market asset: buying electricity when the system values it least and preserving the option to sell when its value rises. The €286.9/MWh maximum daily spread shows the size of the opportunity; the simulated €112 gross revenue shows why converting that opportunity into cash requires disciplined dispatch.
Simulation Note
Written by
Dr. G. O. C. Okwuibe
Quantitative Energy Systems Expert | Electricity Market & BESS
Dr. Godwin Okwuibe is a quantitative energy system expert specializing in electricity markets, battery storage optimization, and flexibility market design. His work focusses on translating complex market dynamics into actionable insights for industry stakehold...